Bayesian Change Point Detection
- Implemented several hierarchical Bayesian models to detect change points in time series data
- Tried linear regression, Gaussian processes, Kalman filter, Gaussian mixture, and Student’s t mixture models
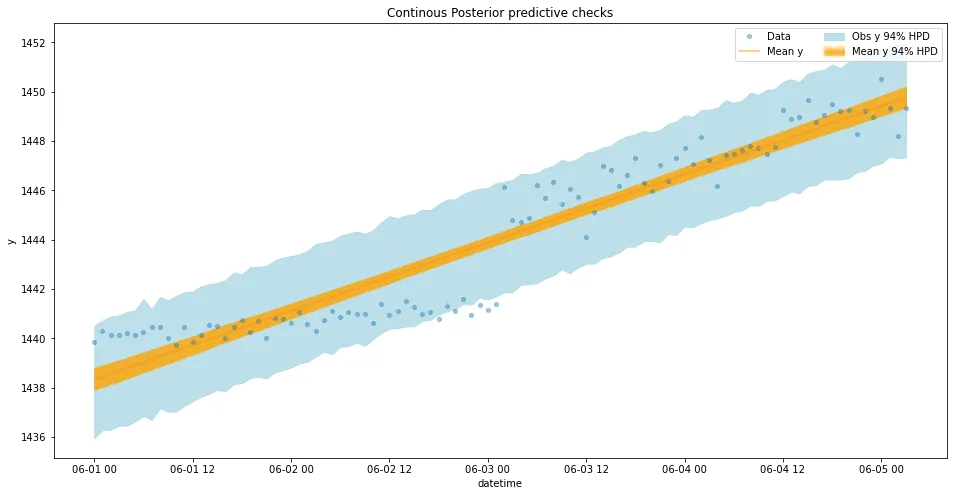
Baseline Model
A simple linear regression model is used to fit the data.
Trace plot is shown below:
Fitted as:
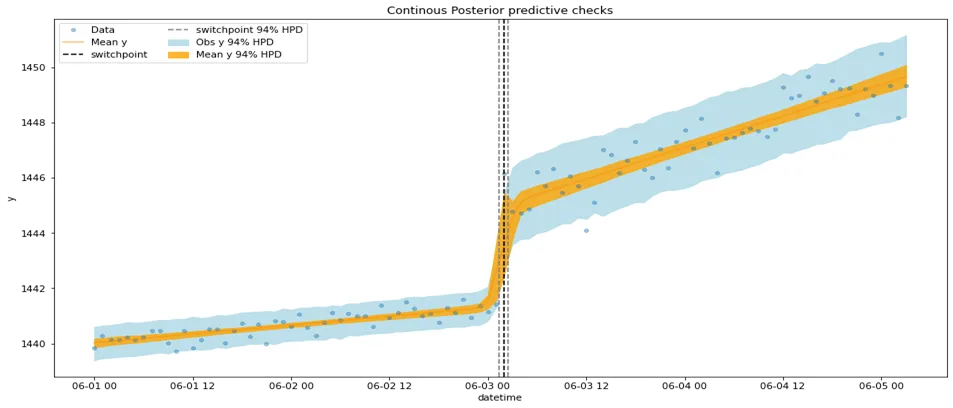
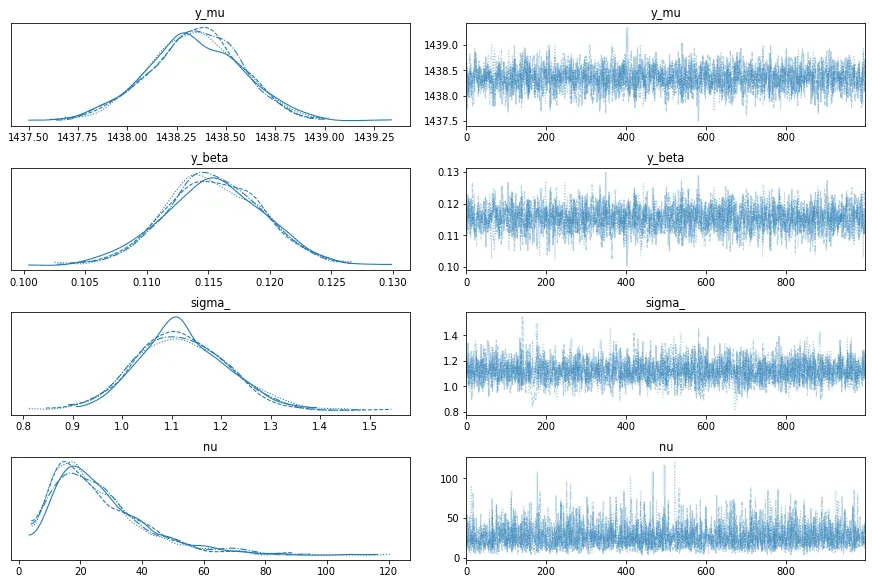
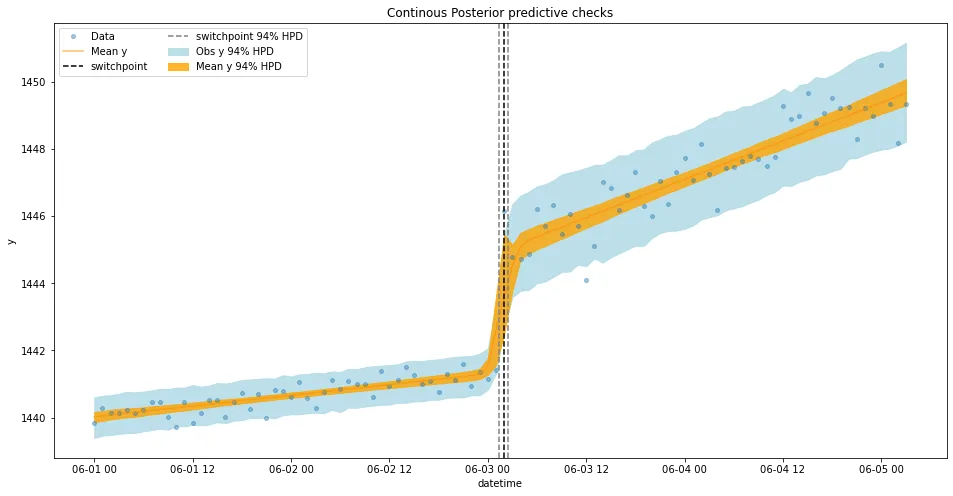
First model
Model architecture:
Trace plot is shown below:
Fitted as:
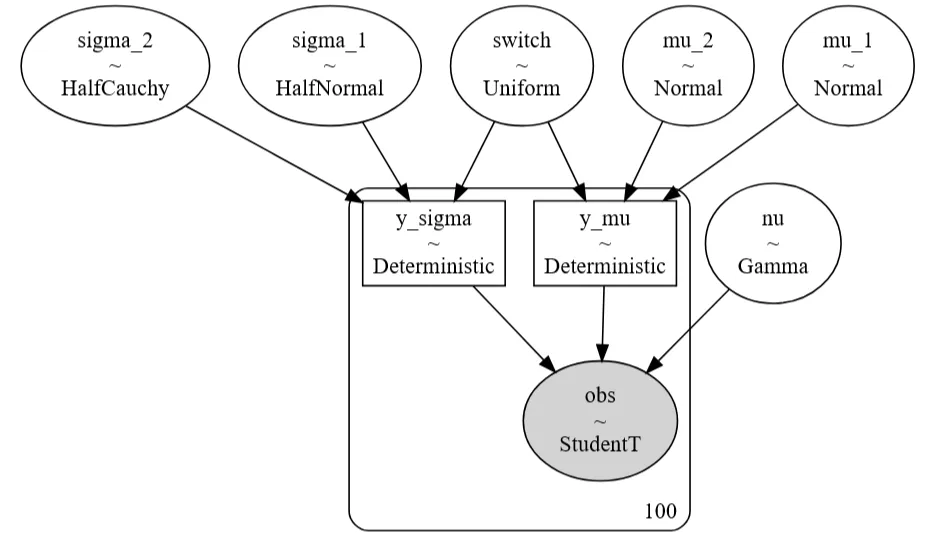
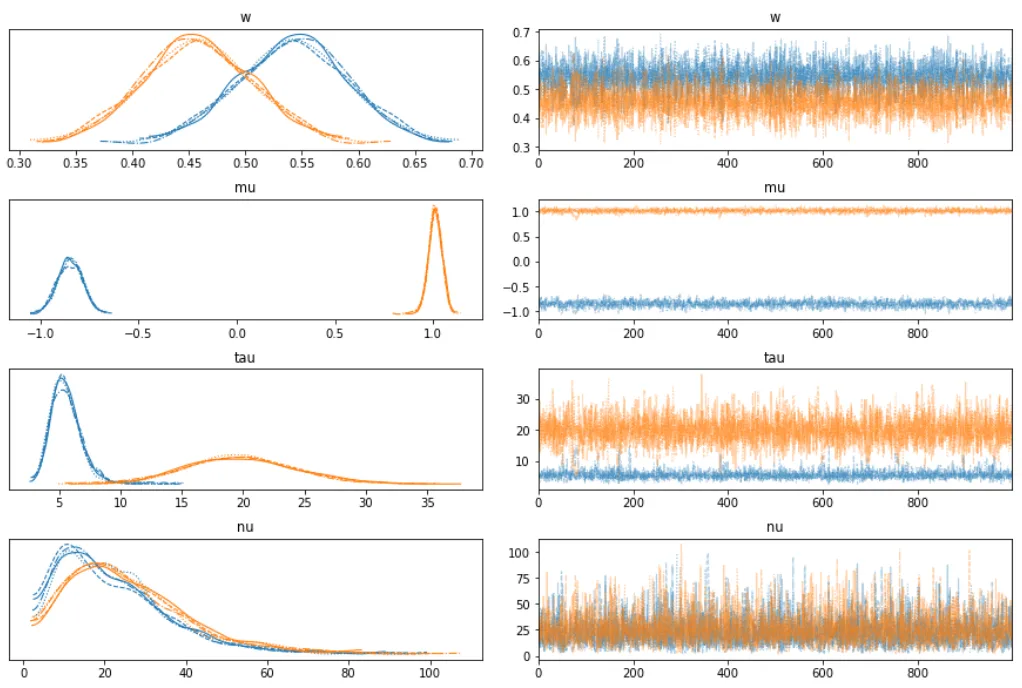
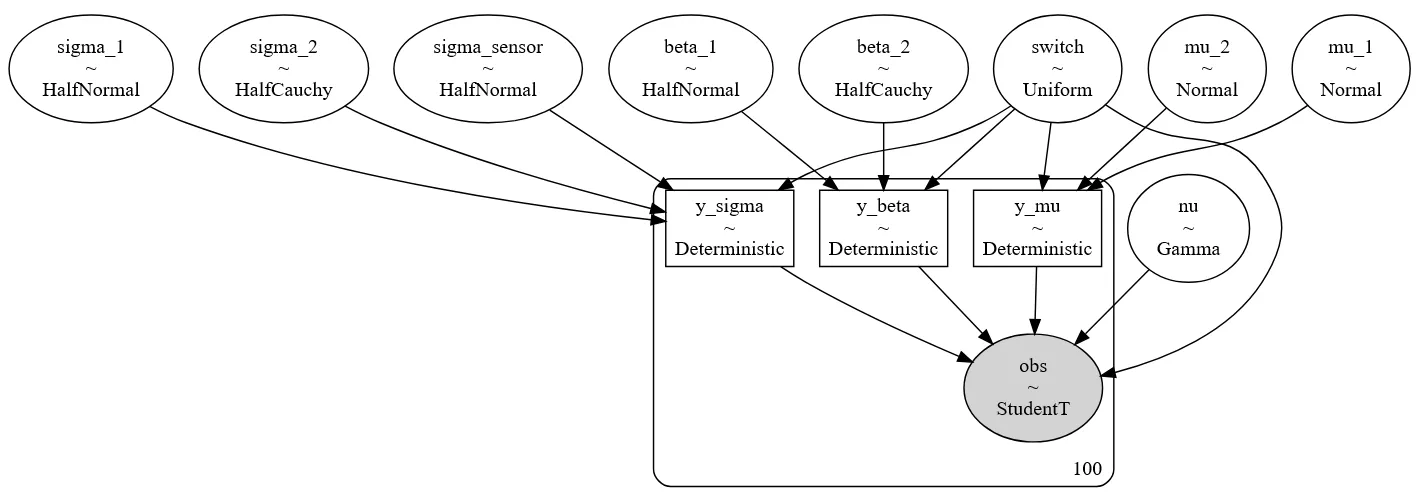
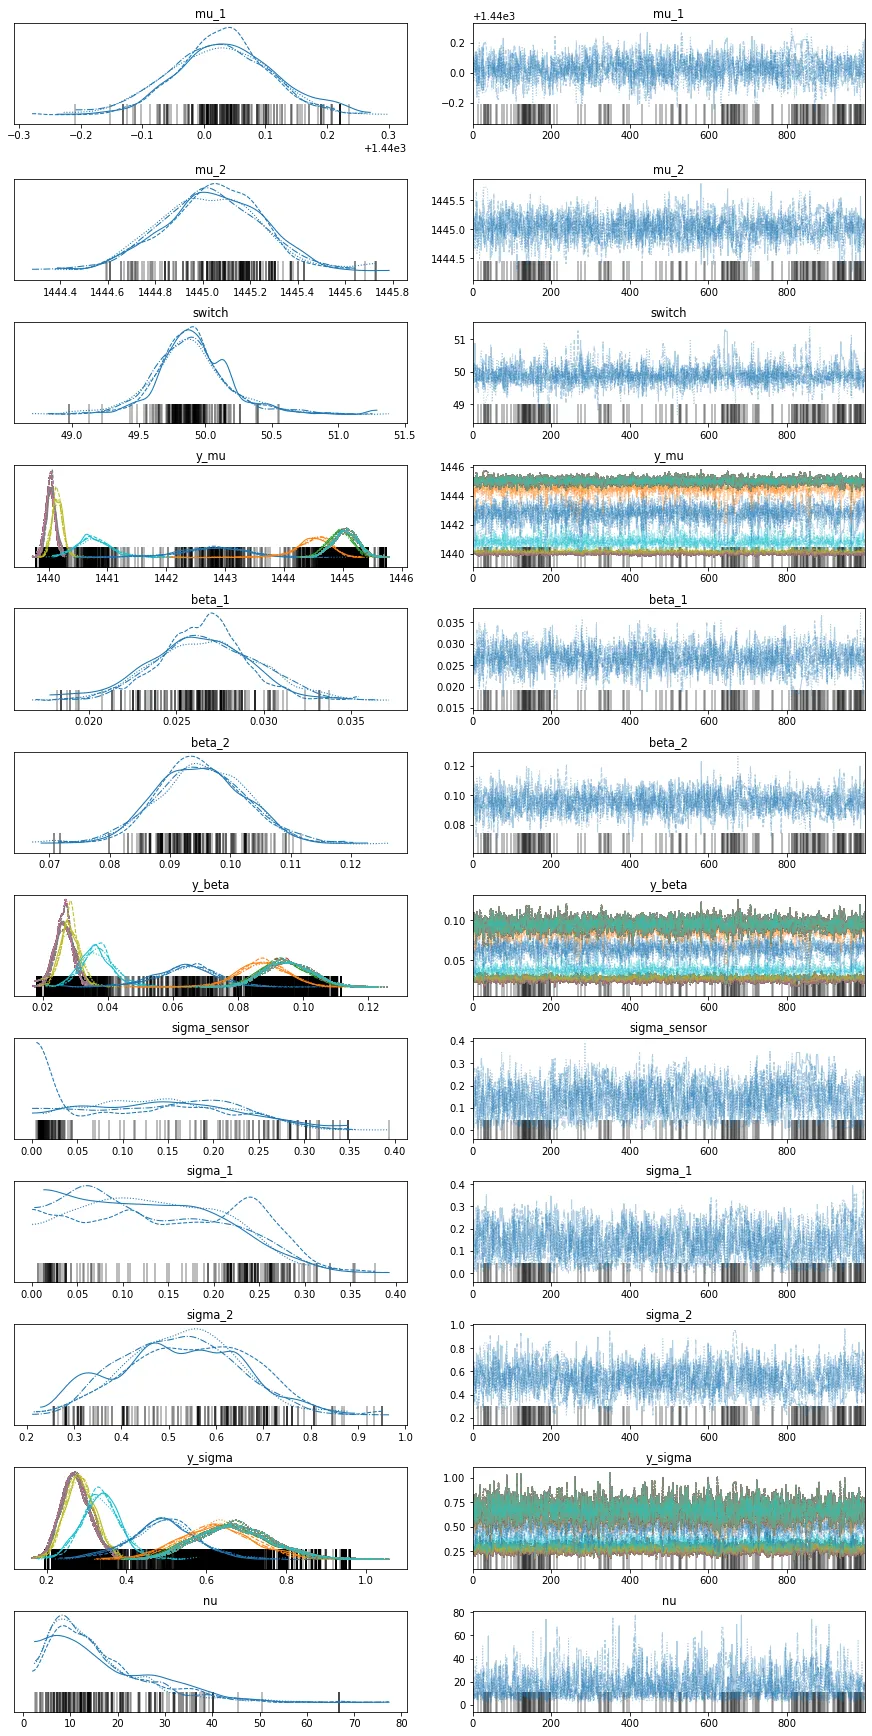
Second model
Model architecture:
Trace plot is shown below:
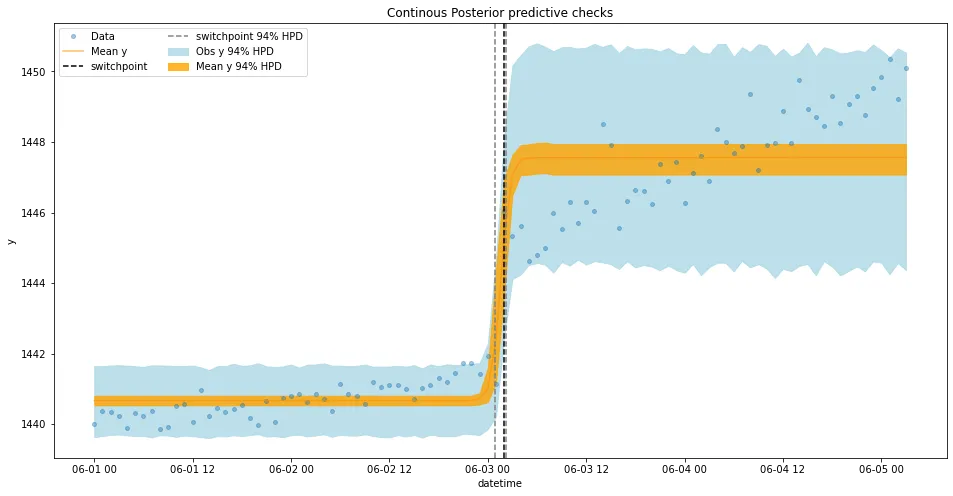
Fitted as:
Comparison
| model | rank | weight | loo | d_loo |
|---|---|---|---|---|
| switchpoint | 0 | 0.971818 | -72.991731 | 0.000000 |
| baseline | 1 | 0.028182 | -158.430899 | 85.439168 |
Rank is the rank-order of the models with 0 being the best model. Weight can be loosely interpreted as the probability of each model (among the compared model) given the data. As a result, the switchpoint model is much better than the baseline model.